
DAX Queries for Power Automate: how to populate Word templates with Power BI data
Sometimes it is necessary to write a report in text format, in Word, for example, which contains data relating to a specific indicator. The most common process is to write the text separately from the numerical values, filling in the data manually, or through “copy-paste” in the document. Wouldn't it be great if we connected to a Power BI dataset and entered the values directly into a document? That's what we'll see in this post.
Power BI semantic data model
The first requirement is to have a Power BI dataset, now called a semantic data model. For this example, we will use the “Competitive Marketing Analysis Report” demo:
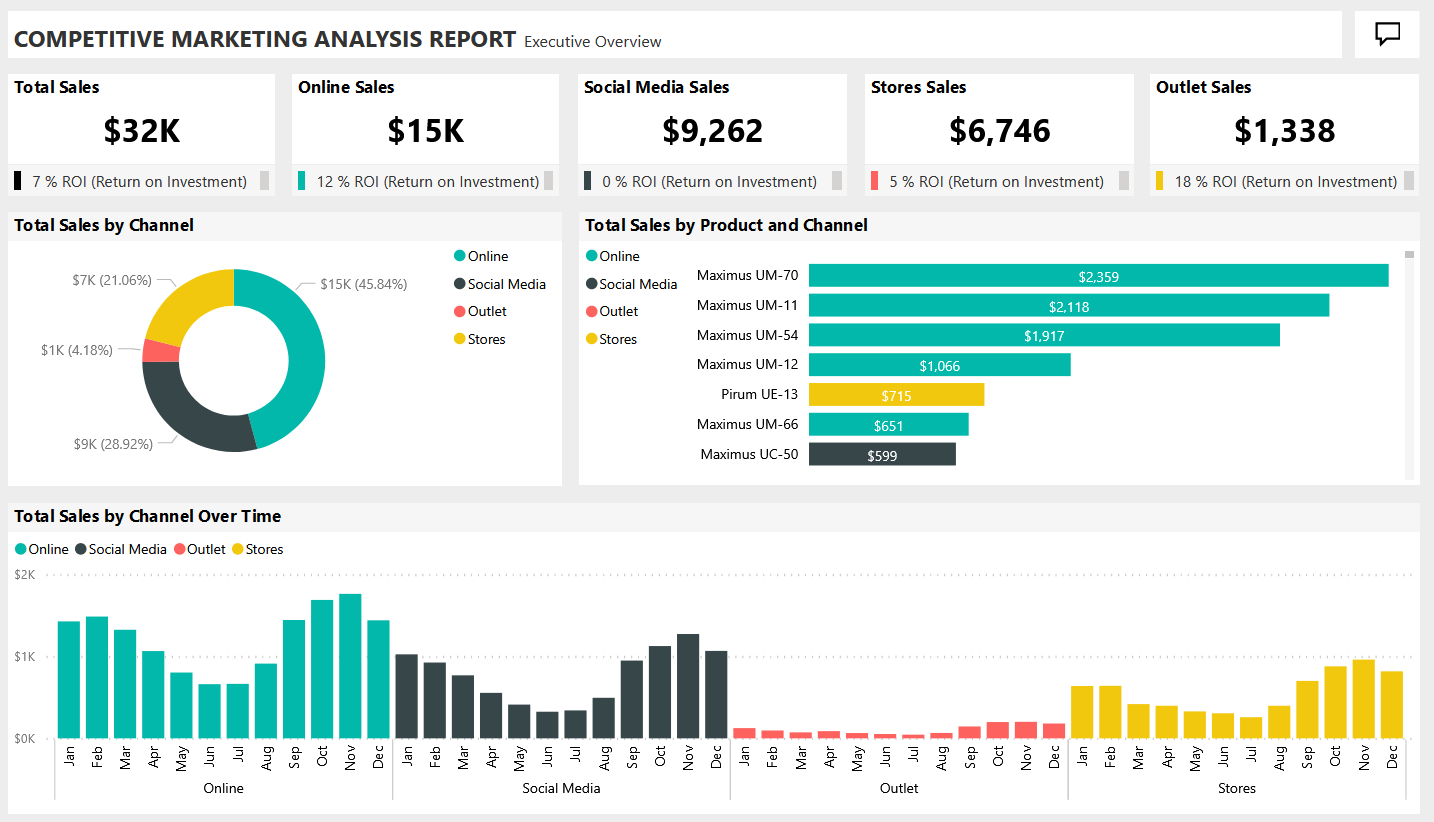
The report contains several pages and in them we can see that there are several interesting indicators, such as sales, units sold, margins, prices, as well as other non-financial indicators, such as the customer sentiment score.
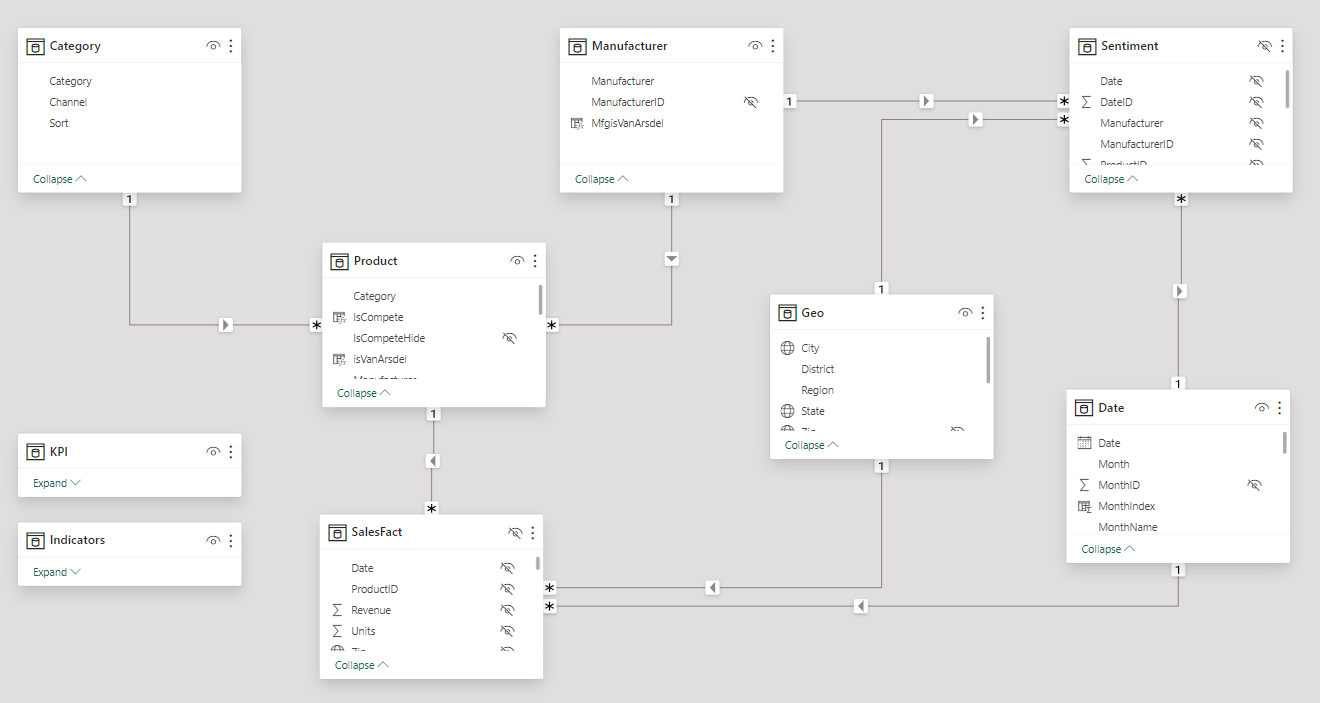
The data model is a “star schema” with two transactional tables: Sentiment and SalesFact:
The Word template
To combine the text with the data from this semantic model, we need a “template”, a Word model that will have a fixed base, written in text, and some “placeholders” where we will store the Power BI data.
This process consists of creating a new Word document and defining where in the text we want to insert numerical data. It's a somewhat tedious process because there are a series of details that can make all the difference:
- First, you will need to activate the Microsoft Word “Developer” menu, in the Word options
- In this menu we will insert an object “Plain Text Content Control”, which is in the “Controls” group
- This object will be placed somewhere in the middle of the text we are writing, as we are interested.
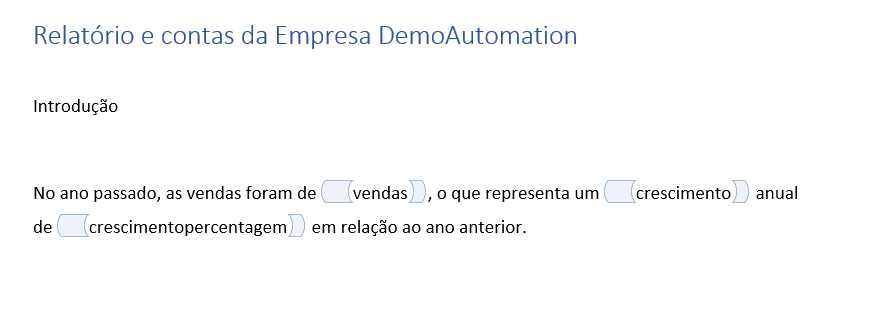
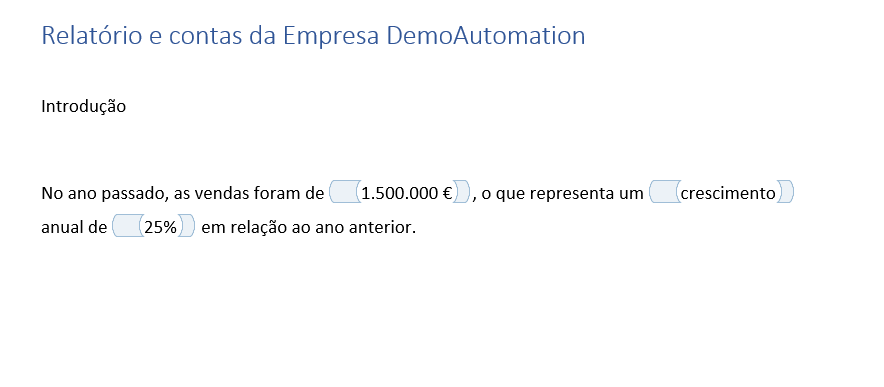
For example, when writing the Report and Accounts of the Company “DemoAutomation”, we would have the following opening paragraph:

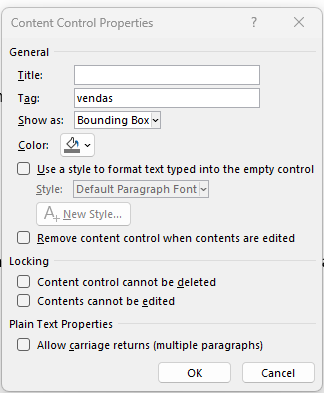
The “vendas” ("sales") placeholder appears just before the comma and is where the data will be placed. When defining its properties, we can check the “tag” that will be recognized in Power Automate:
After completing the first paragraph, we could arrive at something like this:
The Word document will be saved in a SharePoint document folder, for example, “Word Templates for Power Automate”, and we will fill in the tags from Power Automate.
Creating a test automation flow
In Power Automate, let's create a flow with a manual trigger and add an action like “Populate a Microsoft Word Template”:
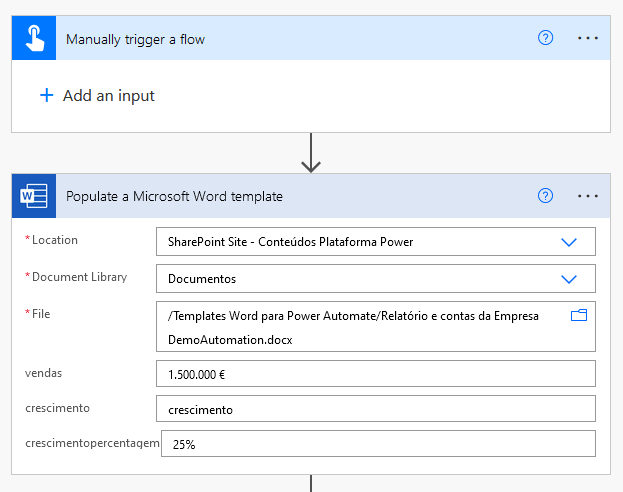
The first three fields are simply the identification of the Word document used as a template, and the rest are the tags created with the data to be inserted.
Running this flow, we will see that it runs without errors, but that the Word template remains unchanged. This happens because the template is only supposed to be used as such and if we want a filled document, we will have to create a new static Word file with the filled tag values.
So, we have to add a new action in Power Automate:
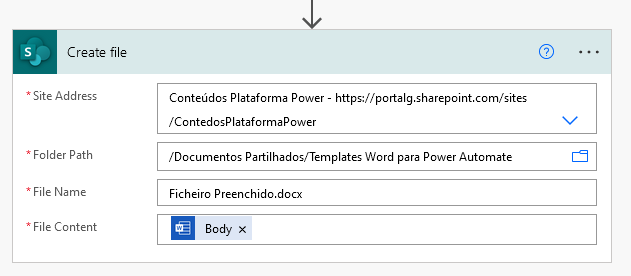
The first two arguments of this step are respectively the location of the SharePoint site and the directory where the file will be created. The third, the name of the file to be created and the last will be the content of the previous step.
Running this flow, let's see the results:
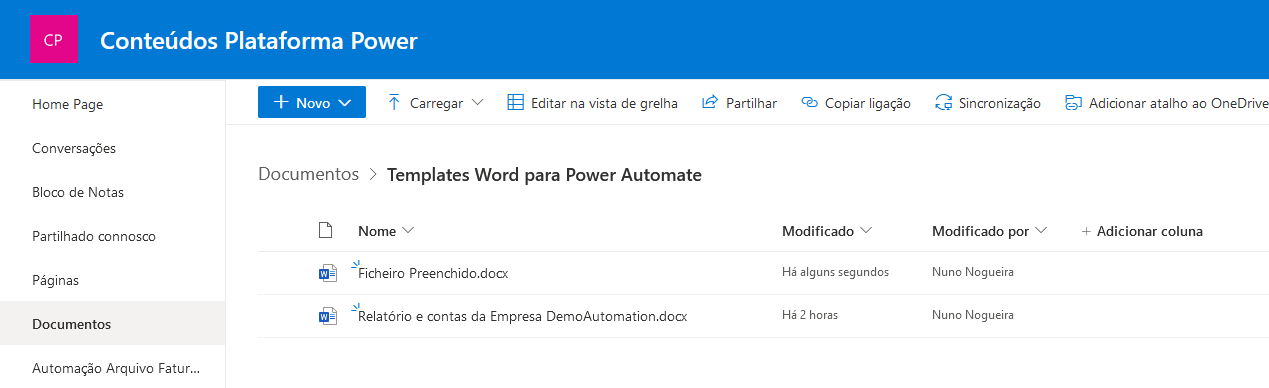
Apparently, the file was filled out correctly and placed in the desired document folder. Opening it we can see the following:
Search data in Power BI semantic data model
Of course, we don't want to fill in the data manually, but rather from the Power BI dataset. The first step is to publish it to Power BI Service so that it is searchable from Power Automate.
So, let's take a step back and start our flow by running a search on the semantic data model. The first step, right after the trigger, will be “Run query against a dataset”:
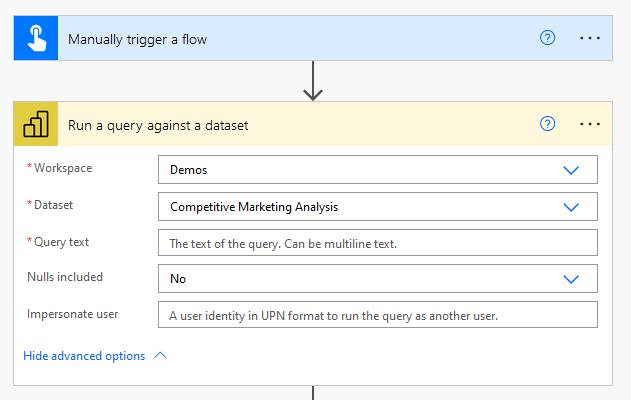
The first two boxes contain, respectively, the workspace where the dataset is stored, and the second, the dataset itself. The hardest part is writing the DAX we want to get from Power BI.
To help us solve this problem, we can go back to Power BI Desktop and add a page where we visualize the data to be imported.
For example, the page for the year 2013 could contain the following visualizations:
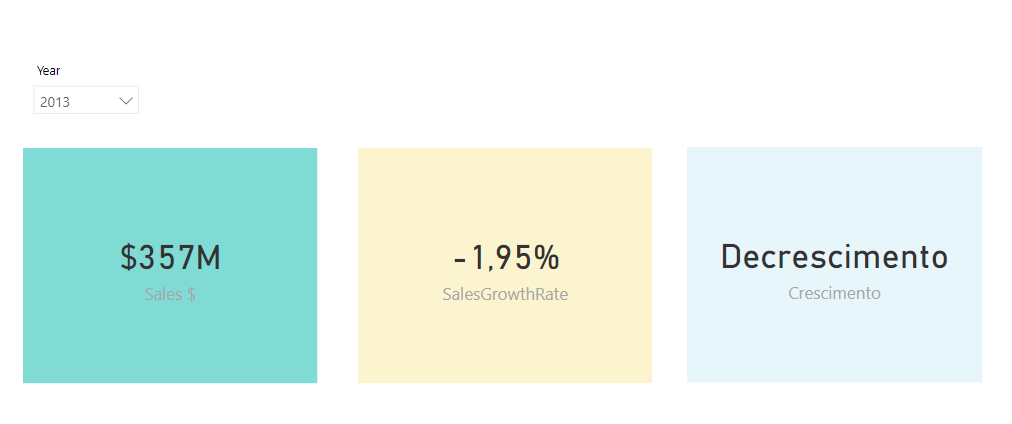
In it, we have a slicer, at the top, selecting the year, and three cards, where the DAX is defined as follows:
- Sales $:
= SUM([Revenue]) - SalesGrowthRate:
= DIVIDE([Sales $], CALCULATE([Sales $], SAMEPERIODLASTYEAR('Date'[Date]))) - 1 - Crescimento:
= IF([SalesGrowthRate] >= 0, "Crescimento", "Decrescimento")
To obtain the query to send to Power Automate, we can activate the “Performance Analyzer” of Power BI Desktop, from the top ribbon:
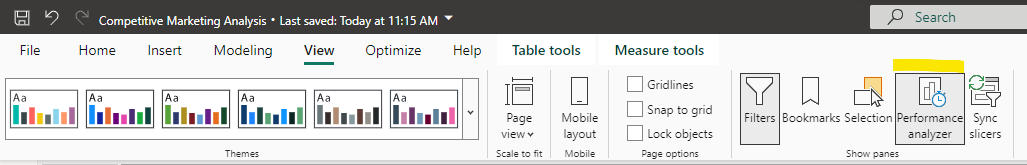
Before using the Performance Analyzer, we will change the report page to force the visualizations to “refresh”. Performance Analyzer allows us to record all user interactions with the report and, when we change pages, it recreates all views.
After opening another page, we will activate the recording of user actions in the right panel, using the “Start recording” button:
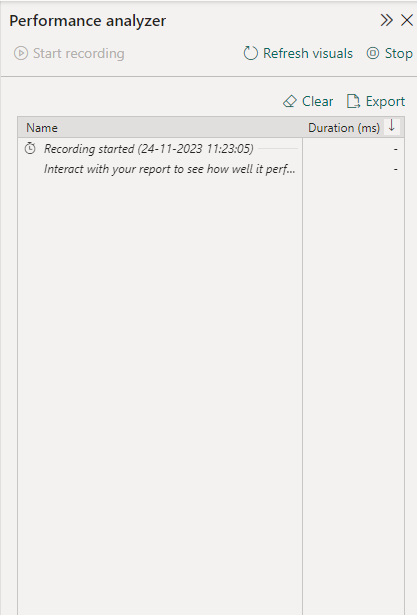
When we return to the page that contains the indicators we are interested in, we see that this panel now contains a series of details about each of the visual elements:
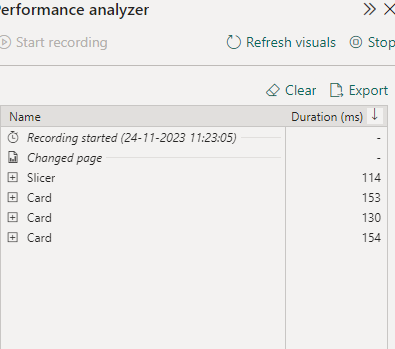
Let’s click “Stop” to stop Performance Analyzer recording and open the first card:
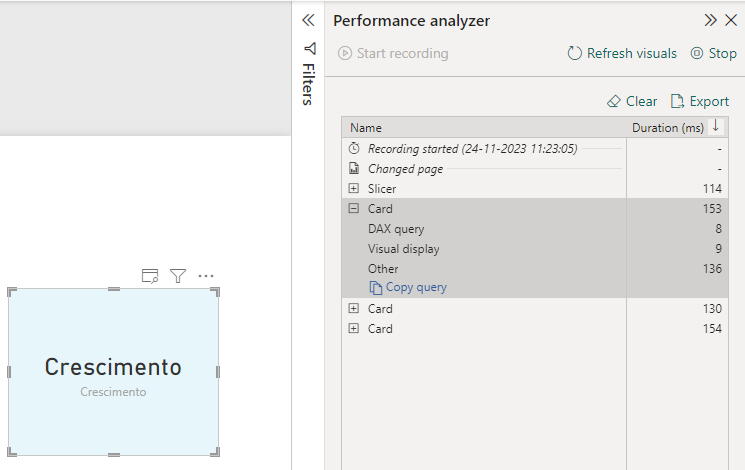
As we can see, it concerns the “Growth” indicator. On the right side of the Performance Analyzer, you can check the duration in milliseconds that it took to be produced. The part that interests us mst is the one in the “Copy query” link. Let's click on this link and the DAX syntax is copied to our machine's memory.
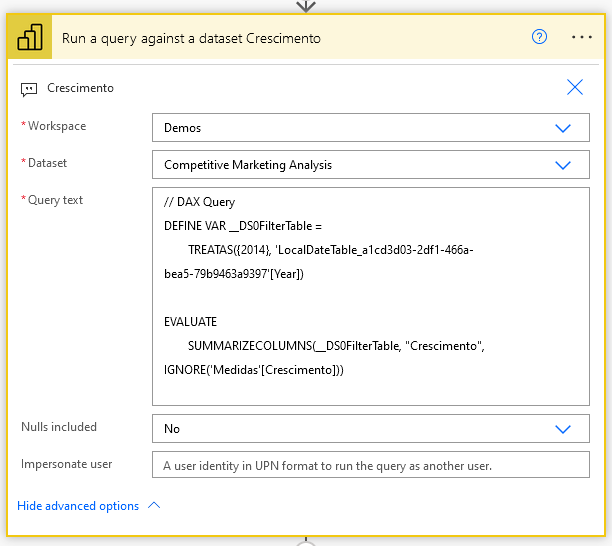
If we paste it into a notepad, we have:
// DAX Query
DEFINE VAR __DS0FilterTable =
TREATAS({2014}, 'LocalDateTable_a1cd3d03-2df1-466a-bea5-79b9463a9397'[Year])
EVALUATE
SUMMARIZECOLUMNS(__DS0FilterTable, "Crescimento", IGNORE('Medidas'[Crescimento]))
This is the DAX that we can introduce in the “Run a query against a dataset” step in Power Automate:
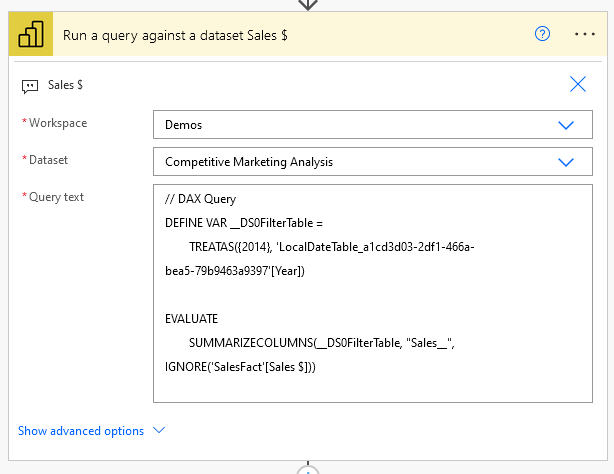
If we proceed in the same way for the other indicators, we will have the following DAX expressions:
Sales $:
// DAX Query
DEFINE VAR __DS0FilterTable =
TREATAS({2014}, 'LocalDateTable_a1cd3d03-2df1-466a-bea5-79b9463a9397'[Year])
EVALUATE
SUMMARIZECOLUMNS(__DS0FilterTable, "Sales__", IGNORE('SalesFact'[Sales $]))
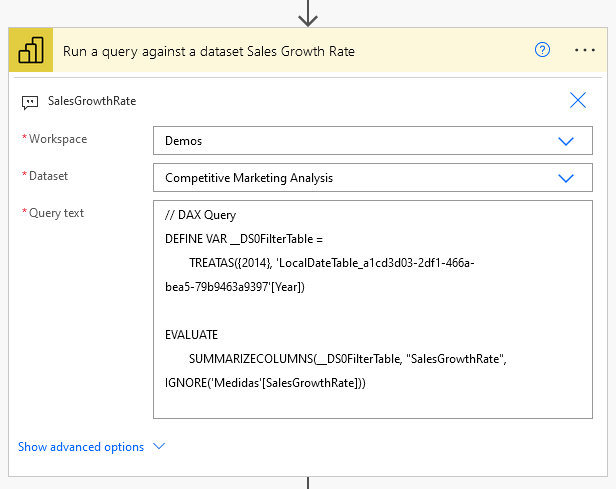
SalesGrowthRate:
// DAX Query
DEFINE VAR __DS0FilterTable =
TREATAS({2014}, 'LocalDateTable_a1cd3d03-2df1-466a-bea5-79b9463a9397'[Year])
EVALUATE
SUMMARIZECOLUMNS(__DS0FilterTable, "SalesGrowthRate", IGNORE('Medidas'[SalesGrowthRate]))
And the flow would now be like this:
The results are returned by Power BI without formatting, which is not useful for writing the Report and Accounts. Therefore, we will add the following steps to format the data into text, percentage value and currency.
Let's start by initializing variables to store the results:
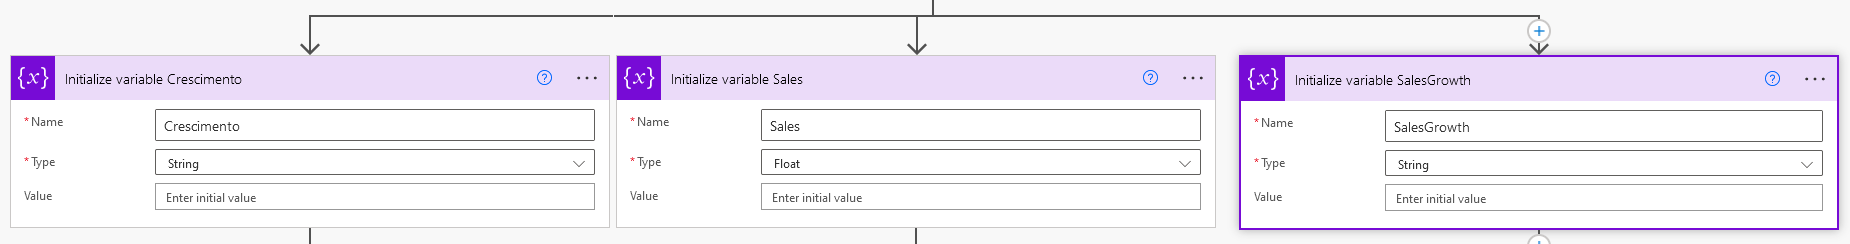
Defining the “Growth” variable in normal text format can be done with the following steps:
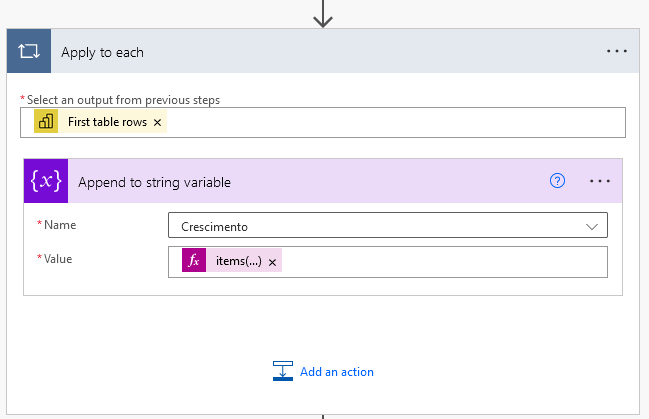
The expression within the “Append to string variable” step is as follows:
items('Apply_to_each')?['[Crescimento]']
Note that this step is inside an “Apply to each” loop, as the result of the query to the Power BI dataset is a table (array) that can contain one or more rows. In this case it is irrelevant, as we are looking for a unique value (scalar).
However, in the case of the remaining variables, we must be careful with the formatting. And for these cases, an additional “Compose” action will be useful to help us.
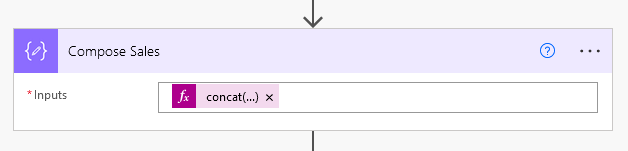
In the case of the Sales variable, we have:
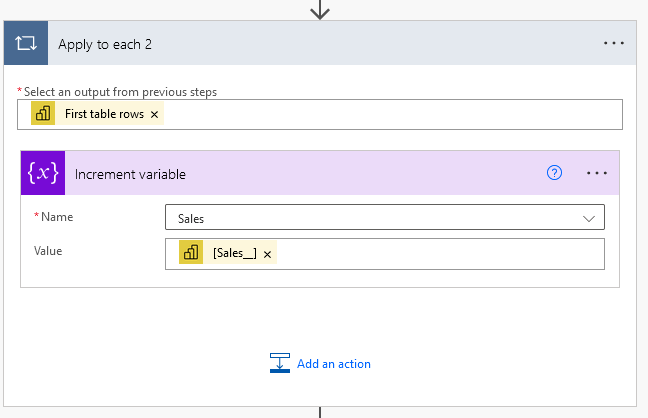
The expression in the “Increment variable” step is as follows:
items('Apply_to_each_2')?['[Sales__]']
As mentioned, in this case, we will add a “Compose” action to format the numeric value. Note that formatting data in Power Automate is a bit difficult and the “Format data by examples” action helps to overcome the main barriers:
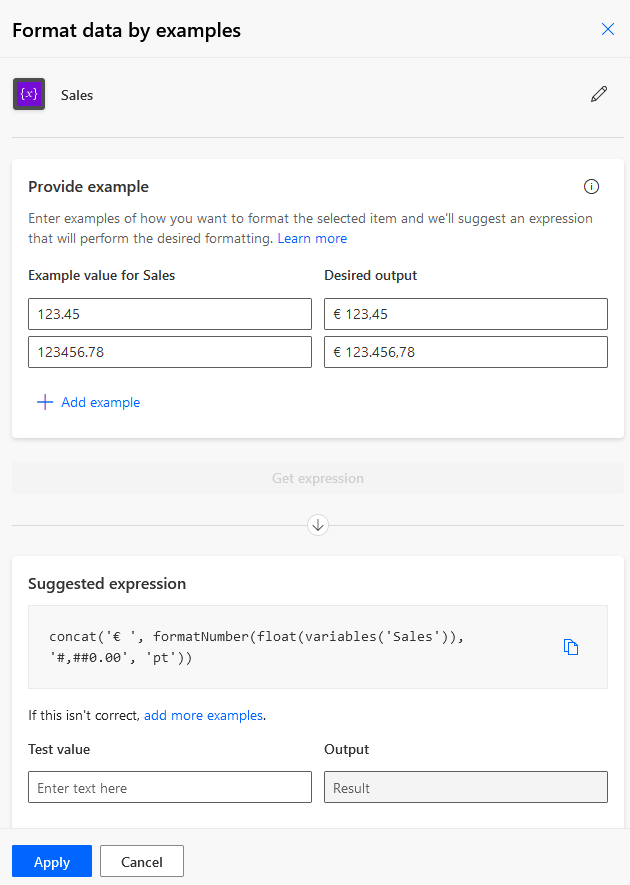
As we can see above, providing some examples to the algorithm, it is possible to obtain the desired expression in the next step:
The last variable can be treated in a similar way:
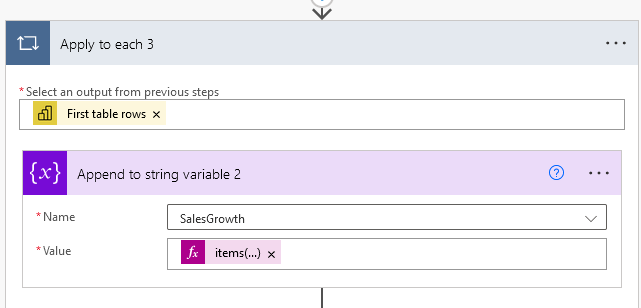
The expression in the “Append to string variable 2” action is as follows:
items('Apply_to_each_3')?['[SalesGrowthRate]']
And formatting through examples could be done as follows:
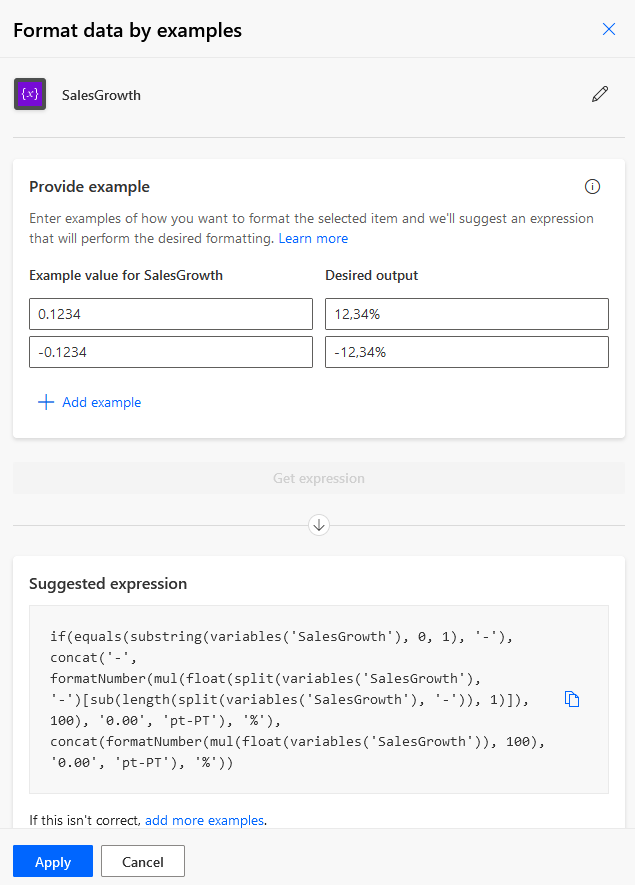
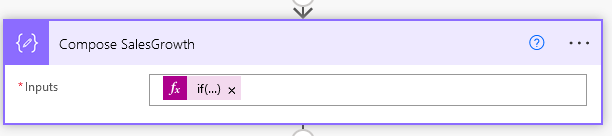
As in the case of the previous variable, we will add a “Compose” action to deal with the “SalesGrowth” variable:
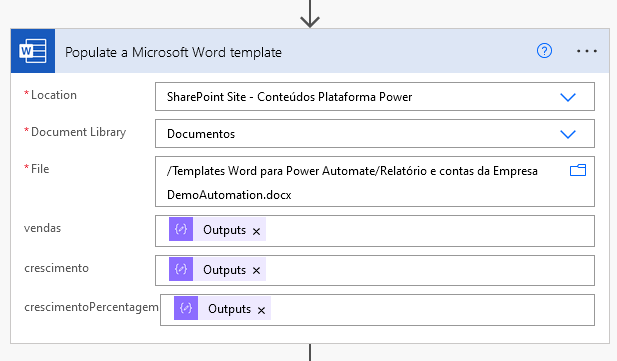
Finally, to finish this demonstration, we would return to the “Populate a Microsoft Template” action and substitute the manually entered data values for the results of each “Compose” action:
And as expected, when we return to our Report and Accounts already completed, the data appears in the Word document with the results coming from Power BI:
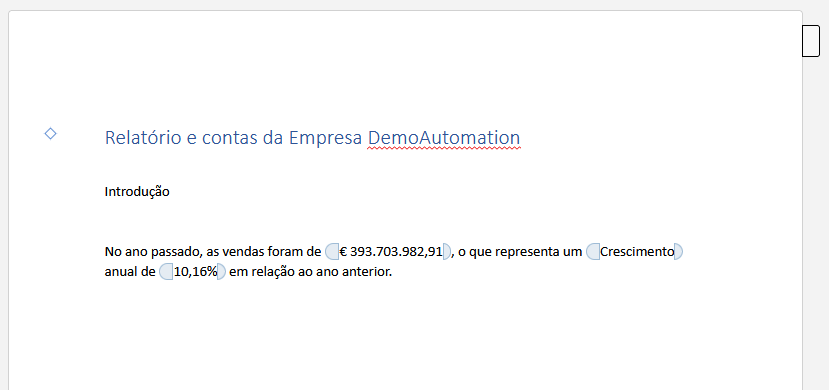
Of course, we could remove the boxes around each of the tags and present the report in exactly the same format as a manually written text.
