
Send data to a Power BI streaming dataset from a CSV file
Within the analytics universe, one of the areas that catches my attention the most (and increasingly so) is real-time data. Due to the fact that data is produced in increasing quantity and quality and the usefulness of it for making decisions “at the moment” when events occur, this is a growing area.
The challenge we will see in this post is to create a streaming dataset in Power BI from a CSV file, available from an API of an application that receives data by the second.
Streaming datasets in Power BI
Streaming datasets are data sets that are a little different from the usual ones. The main difference lies in the fact that they expand in real time when certain events occur.
In other words, with each occurrence of a certain event, be it, for example, the creation of a new order, the streaming dataset immediately adds a new line to the dataset. If we visualize the data from this streaming dataset on a dashboard, the visualizations are also updated in real time.
Therefore, unlike normal Power BI datasets, streaming datasets do not update at fixed moments in time or on demand, but rather when something happens.
Another important feature of Power BI streaming datasets is the possibility of preserving history. If this option is selected, the entry of a new record in the dataset will not result in the removal of the oldest one. This question is relevant if we are interested in not only visualizing streaming data, but also analyzing long series using complex DAX measurements, for example.
Real time doesn't really exist
In fact, when we refer to “real time” we are (really) referring to low latency. This means that the event occurs and the streaming dataset reacts within a few seconds. The dashboard views will react a few seconds later.
For most scenarios, this is not problematic, but, to be strict, real time does not exist, as it is impossible for something to happen at a certain moment in time and a graphical representation of that event to occur simultaneously.
Some technical challenges to consider
In a real-time scenario, there are two technical challenges that we cannot ignore:
- The most obvious is the one that deals with adding new rows to the dataset. This is particularly difficult to resolve if we are dealing with many events occurring simultaneously.
- Another challenge, which may not seem so obvious, is how to analyze data if it arrives all the time?
To calculate certain indicators, such as averages, minimum and maximum values, just to mention a few simple ones, requires a certain computational capacity that can consume more time than is available for updating the calculations and visualizations. There are some new developments in this area that I will return to in a later article.
Our practical case: sending data from a CSV to a streaming dataset
In this challenge, the application produces a large data set, available through a CSV file, which can be accessed from a given URL. The aim is to send a line to the streaming dataset every time an order (a CSV line) is created – as quickly as possible.
The CSV has the following structure:
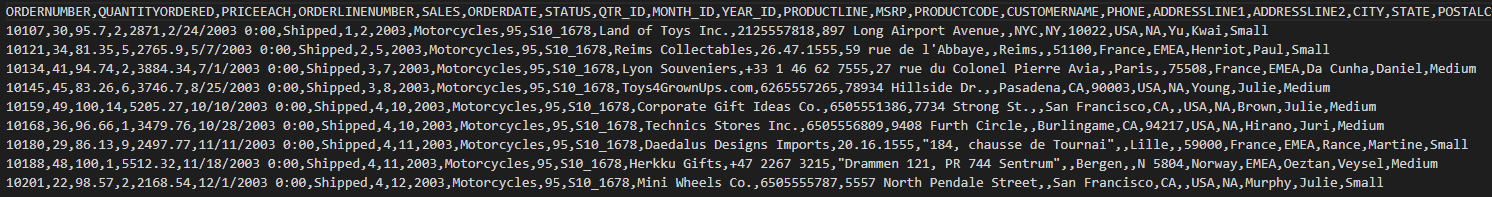
As we can see above, the file contains a series of columns that are separated by commas. Of these, we are only interested in the following:
- ORDERNUMBER
- QUANTITY
- PRICEEACH
- SALES
- STATUS
- CITY
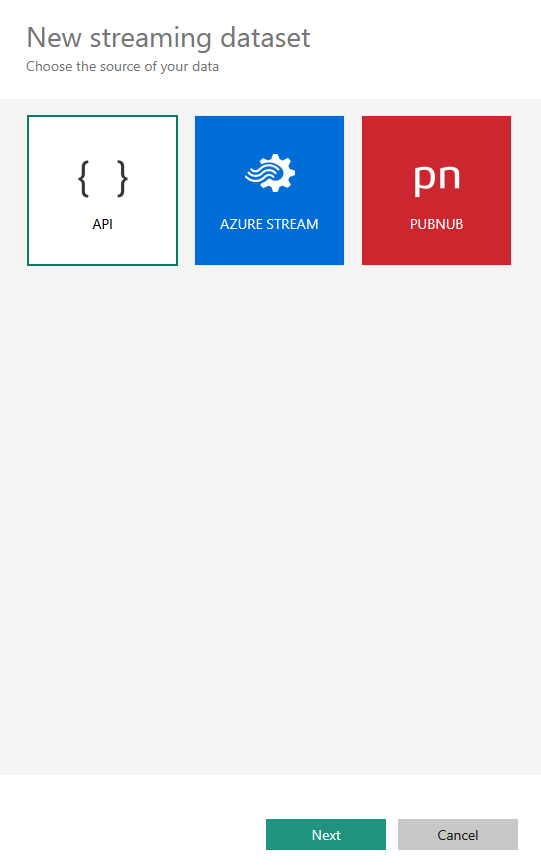
The first step is to create the streaming dataset in Power BI Service. To do this, we choose a workspace and select “New -> Streaming dataset”.
Then, we select the “API” box and continue:
The dataset definition appears in the following box and in it we enter the names of the desired columns and their respective type:
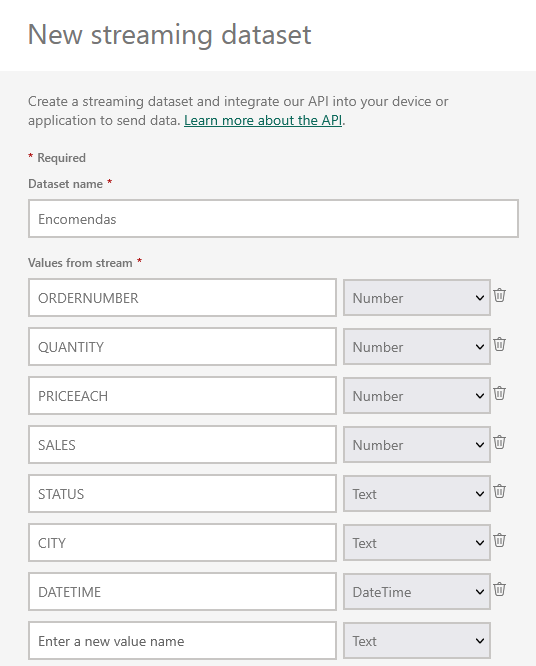
To the previously identified columns, we added the DATETIME column, which will identify the “timestamp” of each order, that is, the date-time of the order.
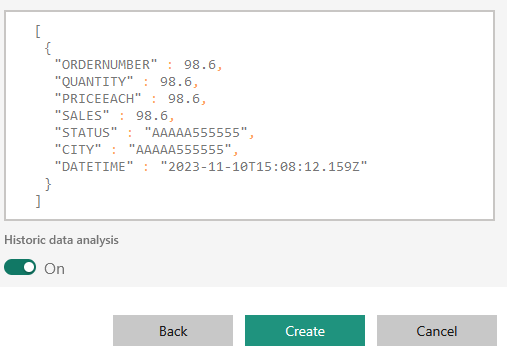
At the bottom of the panel, we can validate that the schema of this dataset is correct, and select the option to preserve historical data.
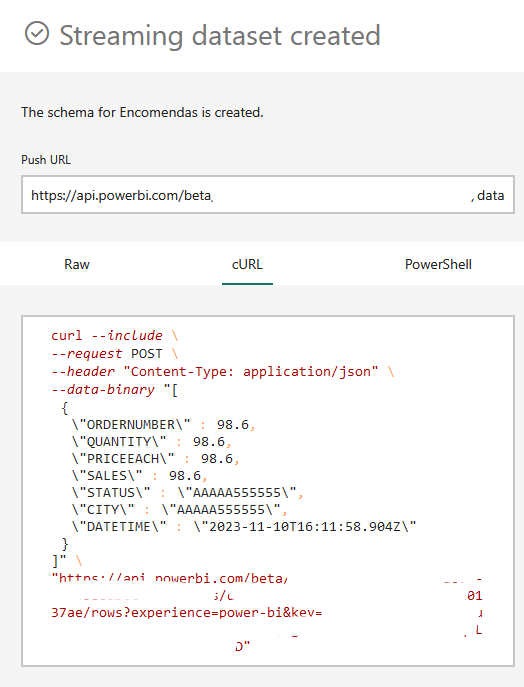
The streaming dataset is created and on the next page we can see the Push URL that will be needed later on to send (“push”) the CSV data here. It is best to store this URL in a safe place because it contains the access key to the streaming dataset.
The heavy lifting is done in Python and I won't go into too much detail in this post. If you are really interested, contact me and I can provide the script, or mayble I'll just write a more detailed post about this operation later.
To create the script, I used Google Colab, a free service from Google that allows you to run Python scripts in the cloud without requiring any preparation work.
Google Colab easily interacts with Google Drive and, for this particular case, this is important as we need to save the most recent order number already loaded into the streaming dataset in the script. The script's work will subsequently be to load orders whose identification number, given by the ORDERNUMBER variable, is higher.
Generally, the script collects data from the CSV file and converts it into a Python data frame and selects the lines to load in the streaming dataset. Subsequently, it defines a data class with 3 properties:
- The endpoint (previously obtained from Power BI via Push URL)
- The data to send to Power BI (in the form of a Python dictionary)
- The intended time in seconds to space each of the CSV lines
Therefore, if we define the data as the path to the CSV and a delay of 1 second, the data will be sent to the Power BI streaming dataset every second a new line.
Real-time visualizations in Power BI Dashboard
All we can do is test the solution by creating a dashboard in Power BI with some graphical visualizations. Only a few visualizations allow you to view real-time data on the dashboard:
- Line charts
- Column Charts
- Cards
- Bar graphs
- Gauges (Gauge)
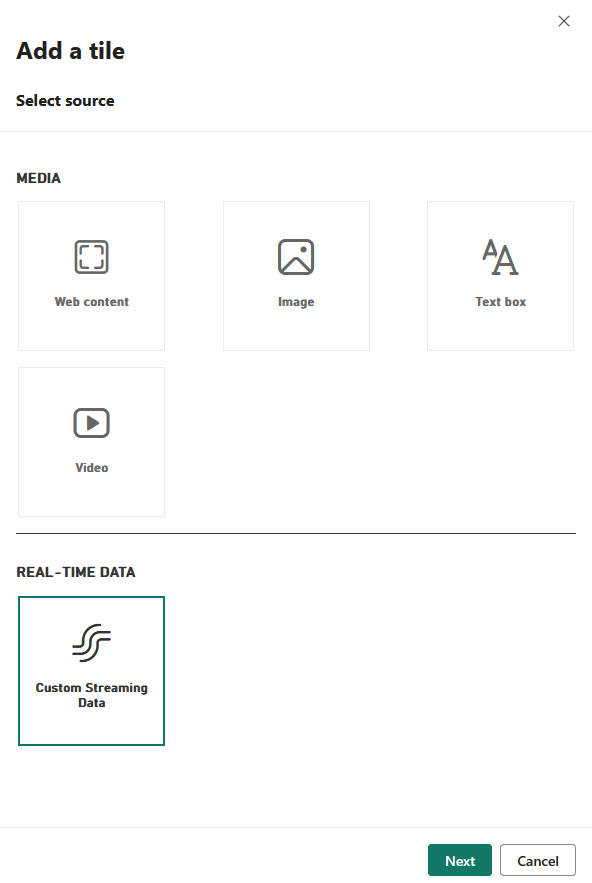
Let's start by creating the dashboard pointing to the streaming dataset created previously, as shown in the image below:
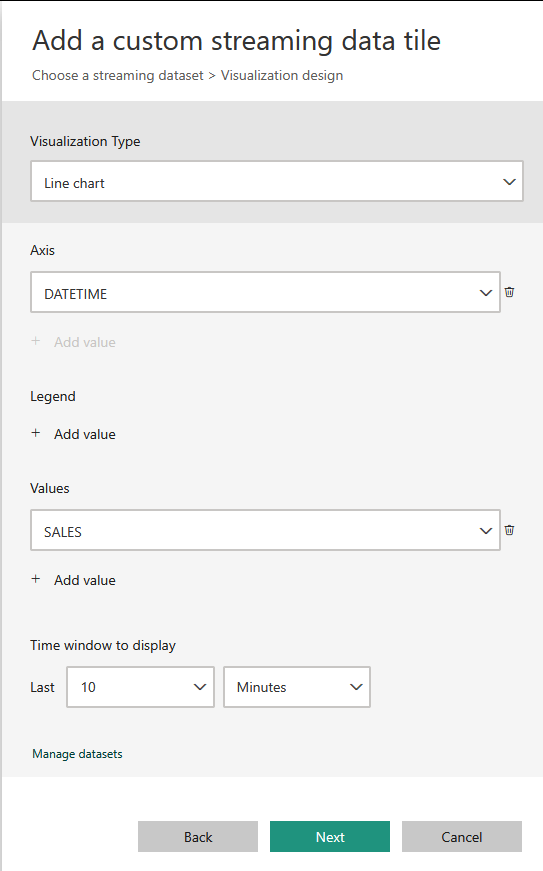
Next, we will select a line graph, with the following parameters:
- On the horizontal axis, the timestamp
- On the vertical axis, the value of sales
- Leaving a 10-minute time window for viewing
Let's give it a title and subtitle of your choice and visualize the result on the dashboard, expanding the width of the graph to half a page:
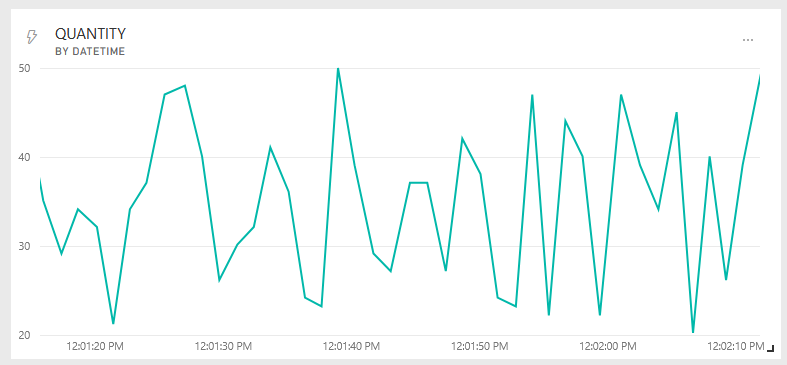
Building a dashboard in Power BI is quite simple and intuitive. It's basically a matter of experimenting and testing until we get the desired result right. For this proof of concept, I came up with a very modest dashboard:
There would still be a lot to do, particularly in terms of analyzing and improving this solution. Maybe in the next post I will return to this project. Thank you for your attention!
