
Text analytics – what our trainees say about us
I started teaching Excel for finance about 10 years ago. In 2015, with the launch of Power BI, I started a series of training sessions on this revolutionary data analysis and visualization technology, with a special focus on business management. Today, we are a team of trainers and consultants and thousands of trainees and more than 500 training events have passed through us. In the beginning, I recorded the data of the training events in a huge spreadsheet, which has since become obsolete and fragile and has therefore been replaced by the Training App, an application for training management developed by ourselves.
With Training App it is possible to manage all operations related to face-to-face and online training events. These operations involve the scheduling of events, the management of trainers and trainees and all the documentation associated with the management of the training, which is quite extensive and required by DGERT.
But one point that has always deserved my special attention is the analysis of the trainees' satisfaction questionnaires. What do they think about the trainers, the content of the actions and what suggestions, comments or complaints do they present?
In this article we will see the analytical part that focuses on the text, the comments, suggestions and complaints. How to analyze this very important dimension and now with a very extensive data set?
The first concern is with data governance, in particular, with the protection of trainees' privacy. Therefore, everything we will see in this article has been properly anonymized and/or changed in order to allow you to view the results without compromising this point.
Trainees complete the satisfaction questionnaire from the Training App support site and the results are transformed and loaded into a Dataverse table. Below we can see a screenshot with an example:
There are several questions to assess the learner's satisfaction and the answers are automatically uploaded to the following table:
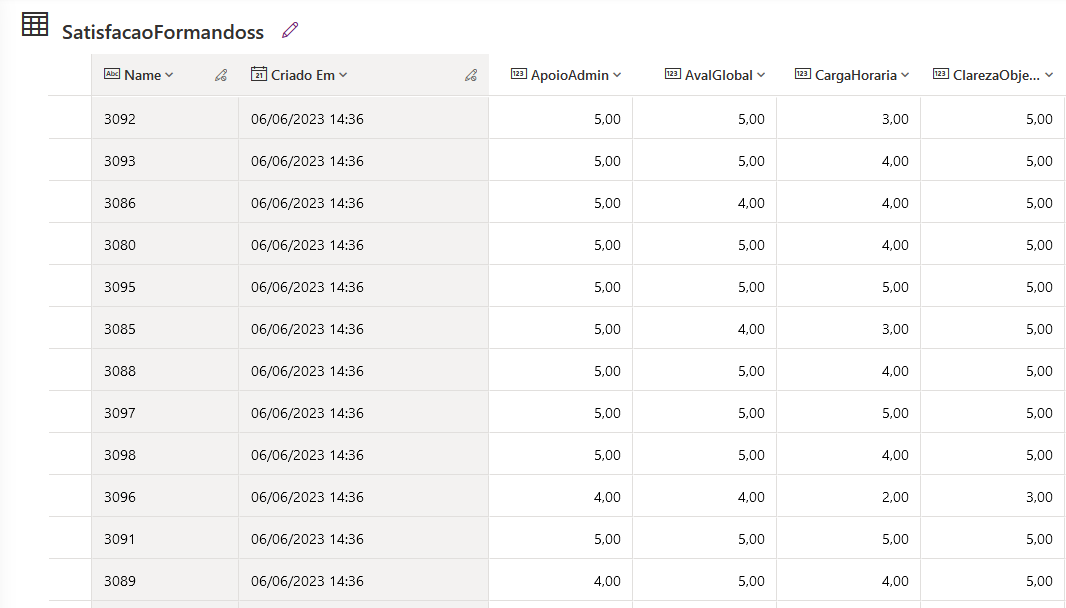
Being in the cloud, in our domain, we can easily analyze the data in Power BI to build charts with the numerical values. However, in this case, the data we are interested in is in text format, in the Suggestions column:
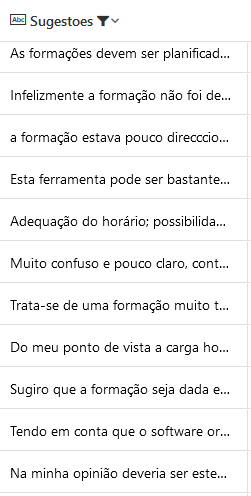
Looking at each of these comments individually, it is relatively easy to understand whether or not the trainees enjoyed the training and which aspects of the training deserve more attention. But, if the volume of comments is large, it will be impossible to analyze all the comments by a human!
This is where text mining models come in to help us. There are several solutions for creating and using such a template. The most versatile solution will be to develop it from existing algorithms with Python or R code, although it is also the most laborious and requires more advanced technical skills.
The alternative, for developers on the Power platform, could be AI Builder, which has these models already properly trained and ready to use. It will be necessary to have a Premium license to use this type of models, but the development cost is practically zero. Let's look at how to implement a solution with Power Automate and AI Builder.
Let's start by creating a flow with a manual trigger and an action to collect data from the Trainee Satisfaction table and the Suggestions column:
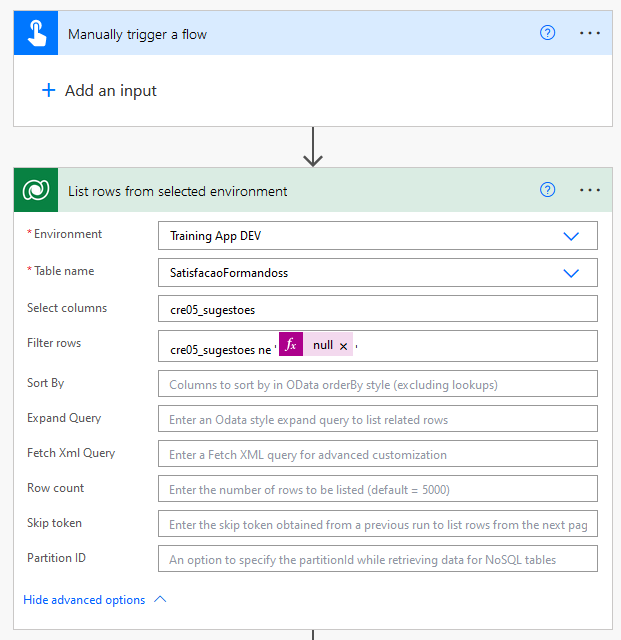
As we already know, the first box is the trigger, in this case a manual trigger that triggers the flow. The second "List rows from selected environment" box is the action, which collects the data from the SatisfacaoFormandoss table from the "Training App DEV" environment where the table is in Dataverse, specifically the "cre05_sugestoes" columa and as long as it is not empty.
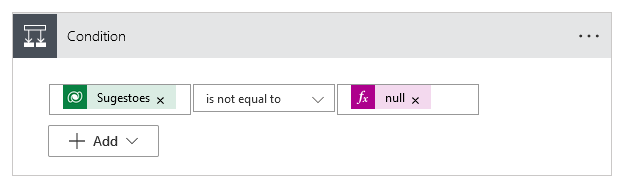
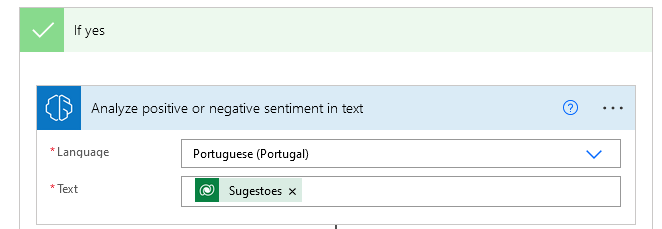
Next, let's add a new action to analyze the positive or negative sentiment of the comments. Again, to make sure we're not passing empty text to the sentiment detection model, let's add a condition:
When we create this action, we see that it is inserted inside an action of type "Apply to each" that is nothing more than a loop. That is, for each line resulting from the previous action, we will apply this condition.
Therefore, the designer updates itself automatically, leaving the flow now with the following structure:
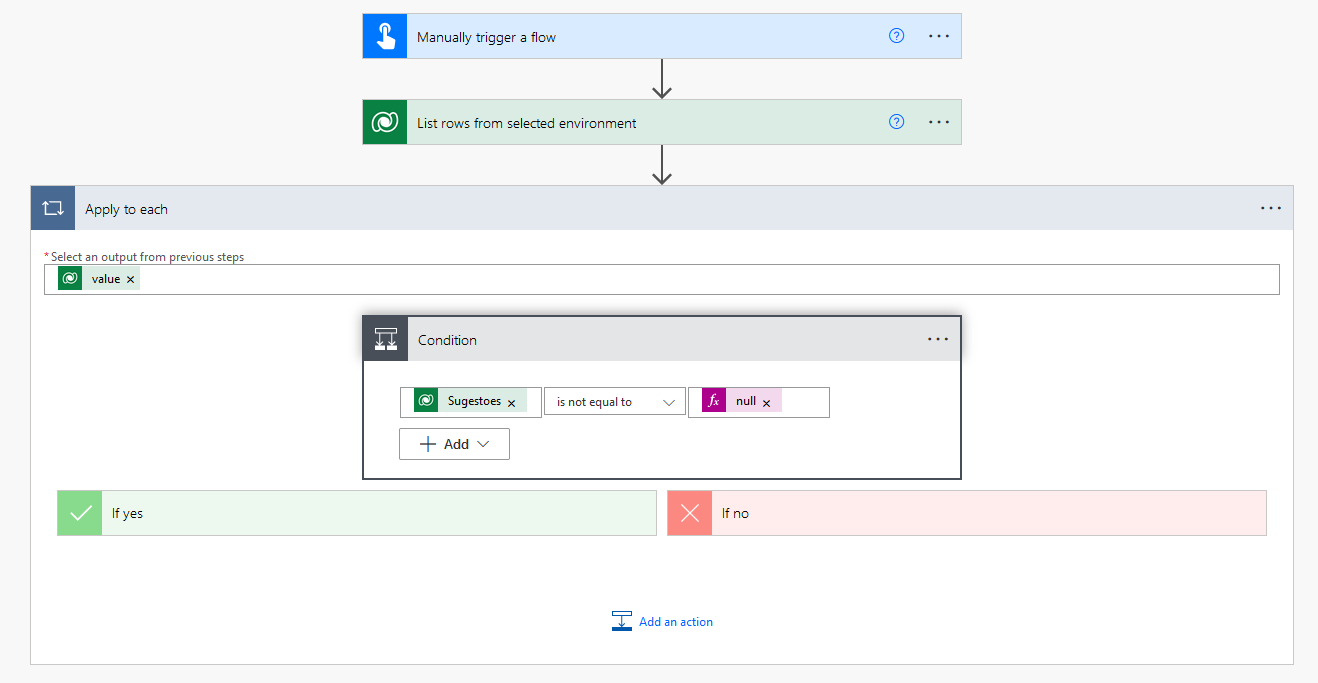
The logical test of the condition validates that the "Suggestions" column is not empty, and if this is true, let's apply the sentiment detection model by adding a new action.
If we run the flow as it is at the moment, everything will work fine, in principle. But it would be better to save the results in a table. It could be the Dataverse table itself, or maybe it would be better to create a new external table, in Excel for example, to separate the original data from the results of our analysis.
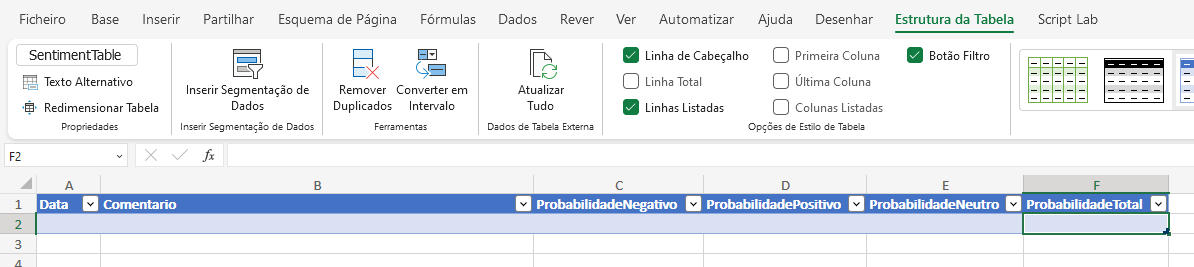
Let's create this table and call it "SentimentTable". It will be used to store the results. So, in Power Automate, the new action to add will be as follows:
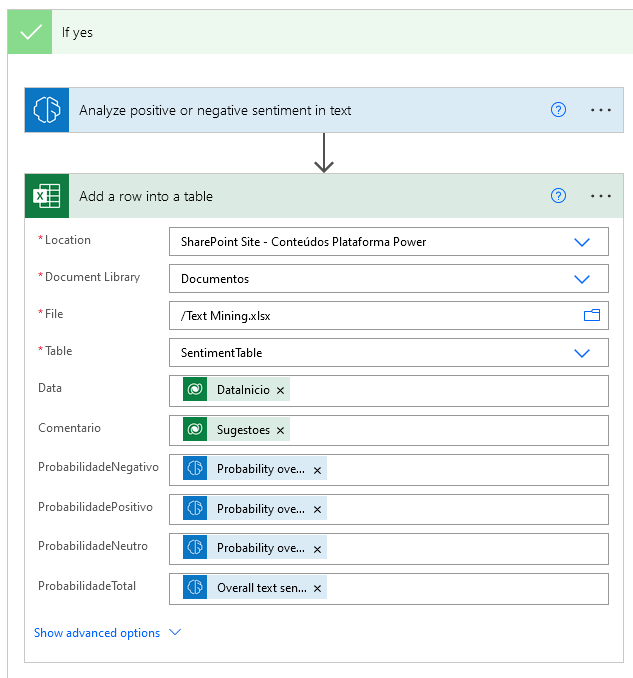
The "Date" column of the Excel file will be fed by the start date of the event. This dimension is important if we are interested in analysing the temporal evolution of feeling: is it getting better or worse over time?
Other columns could be considered here as well. For example, the name of the trainer or the course in question.
In addition to this, we also have the text of the comment itself coming from Dataverse, with the following four columns being fed by the results of the model. AI Builder returns as results the probabilities of a given text being positive, negative, or neutral, as well as the final conclusion regarding sentiment, which results in a "positive", "negative" or "neutral" rating.
Let's test the flow and see what results we get in Excel!
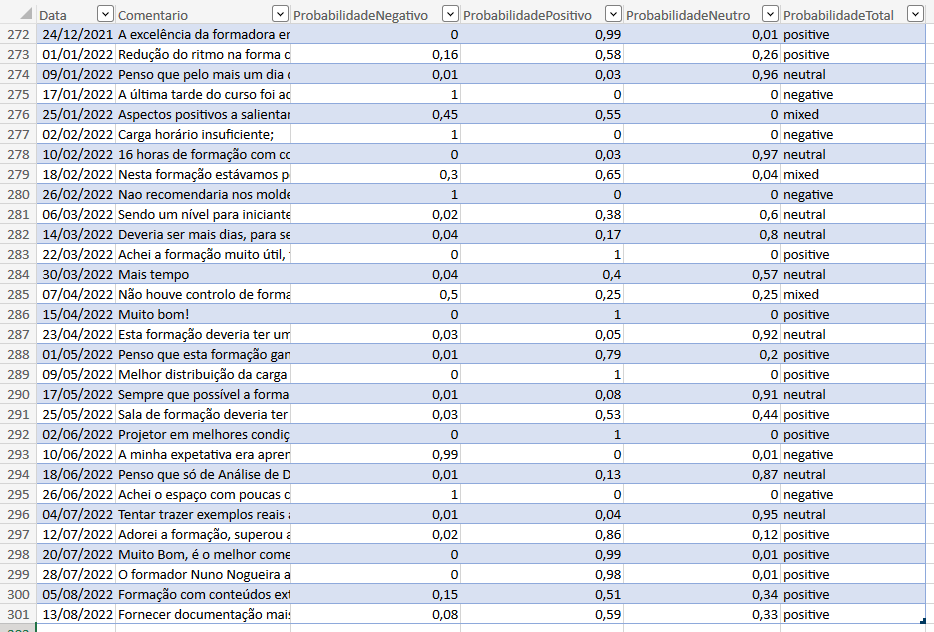
With this data, it is possible to analyze several aspects. For instance:
- The count of each of the 3 classes, negative, positive or neutral
- The average of the probabilities of the negative and positive classes
- The evolution of global sentiment over time.
Refining this sentiment analysis a bit more, we found that there are a lot of neutral comments. The majority of trainees give a positive comment, about 50%, with the neutral class being the second most frequent with 29% of the comments.
What do the trainees say within each of these classes? And overall, which topic or topics have the most comments?
To answer these questions, we can adapt the above flow to use another model and save the answers in Excel, in the same table, or in another accessory table.
Assuming we create the KeyPhrases table, we could adapt the flow as follows:
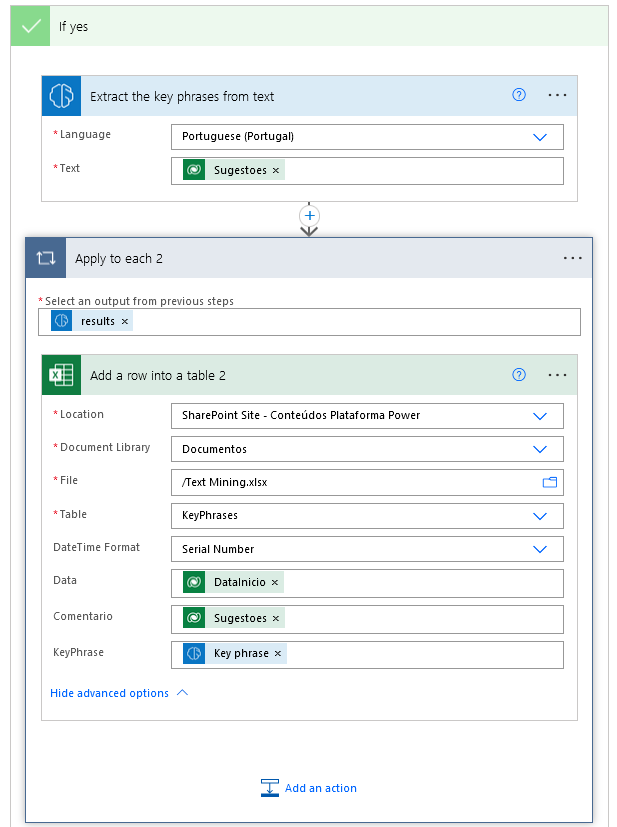
As we can see, this model is similar to the previous one in the way we designed the flow, but it is different in the results. A comment can contain more than one topic, so when entering the results in the Excel table, we will need a new "Apply to each" loop that, for each comment, introduces the key-phrases.
Analyzing the result can now be as simple as creating a pivot table with the counts of each of the key-phrases. It should be noted that there would still be some work to transform these results, as they are not always properly cleaned. We could turn all topics into lowercase or uppercase to avoid multiplying them in several different results, eliminate neutral topics such as "type", "to", "a", etc. that add nothing to our analysis, filter out unreasonable comments such as strange characters, errors, etc.
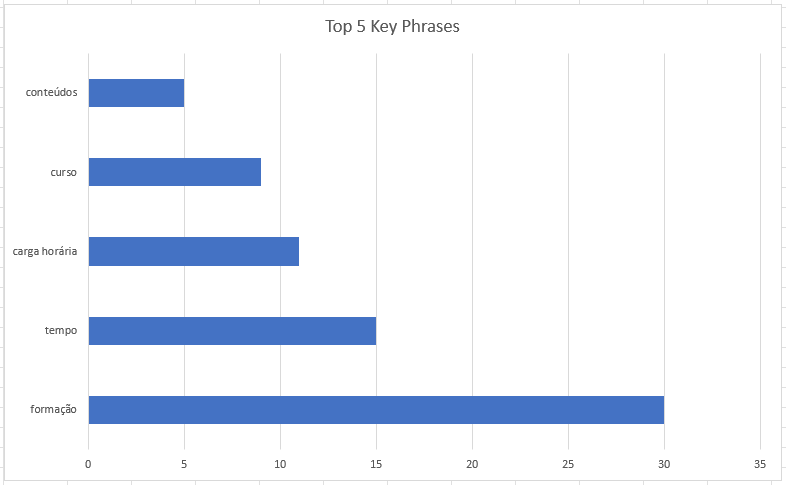
In the chart above, we can quickly visualize what motivates trainees the most. I believe that the two main concerns are the content (I suppose the quality of the content, the depth, the interest and the relevance), as well as the workload, if we assume that the topic "time" has the same meaning as "workload".
These insights are extremely valuable to us and help us decide how to tailor our training offer to our trainees. I think that any company or organization will be able to implement a solution of this type without great investment and extract enormous value from it.
